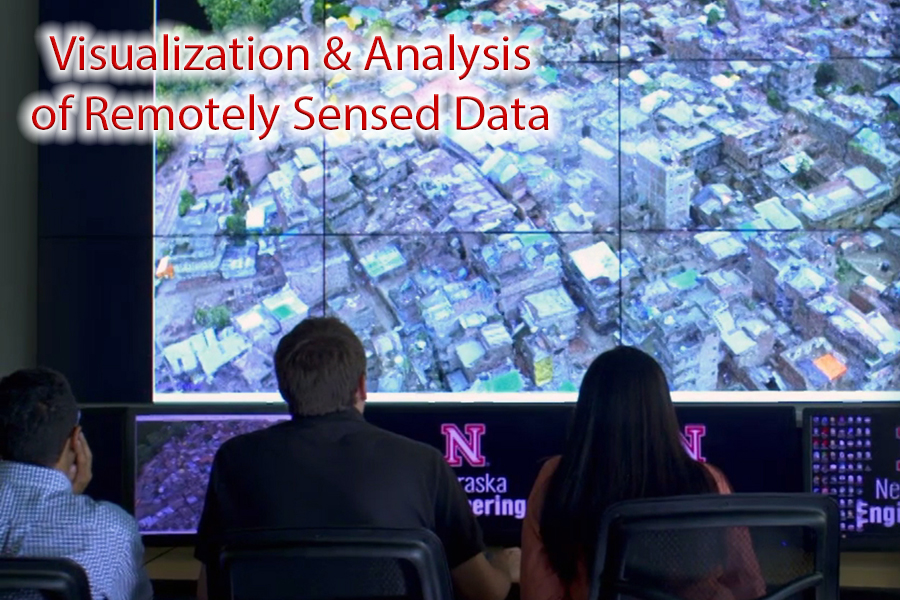
Example Point Cloud Datasets.
2019 Hurricane Harvey in the Bahamas
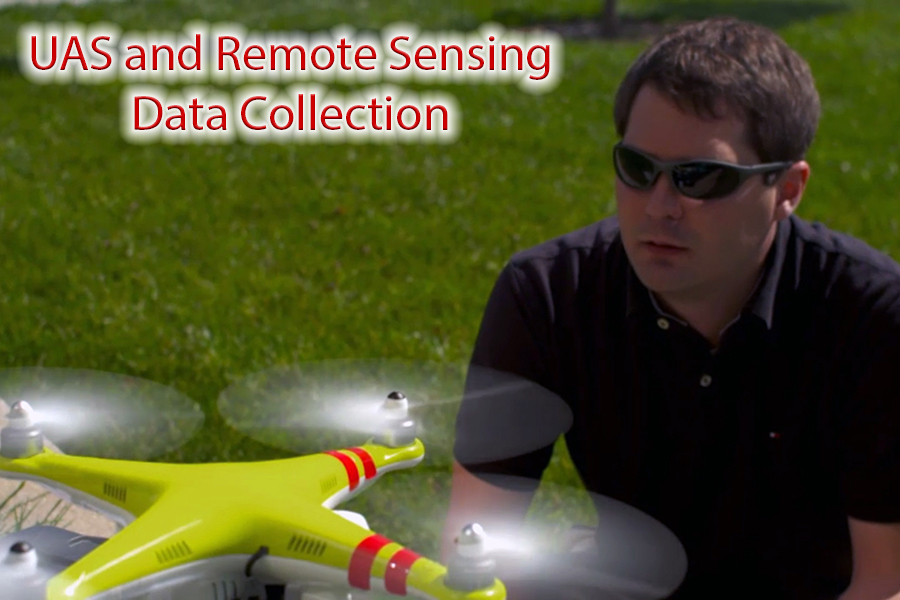
Ground-based lidar point clouds at four sites on Grand Bahamas Island. Data collection was financially sponsored by NSF-StEER. Reconnaissance data were collected in early October 2019. FAST-2 Imaging team was led by Richard Wood (UNL) with team members Henry Lester (South Alabama) and Mike Vorce (Site Tour 360), with planning and coordination by the StEER leadership team. Assistance in aligning the data was provided by Ebrahim Mohammadi.
Mclean's Town, East Grand Bahama Island
Communication Tower
Boat Repair Facility
Freeport, West Grand Bahama Island
Sir Jack Hayward Bridge (evidence of surge)
University of the Bahamas
2019 Spencer Dam Failure
Point cloud and orthomosiac following the failure of the Spencer Dam in March 2019.
Damage Detection on Cornhusker Bridge Pier
Point cloud collected to demonstrate the developed surface damage detection algorithm. These structural components are of differing geometric shapes and only a single dataset was collected. Surface damage detection algorithm utilizes three geometric invariant features.
2018 Iowa Tornado Outbreak
Point clouds collected capturing the tornado damage at Pella and Bondurant, Iowa. Data was collected using an unmanned aerial system only. Used to determine global and local failure patterns of the Vemeer Plant and cornfall directions.
2018 Iowa Tornado Webpage Link
2017 Cather Pound Demolition at UNL
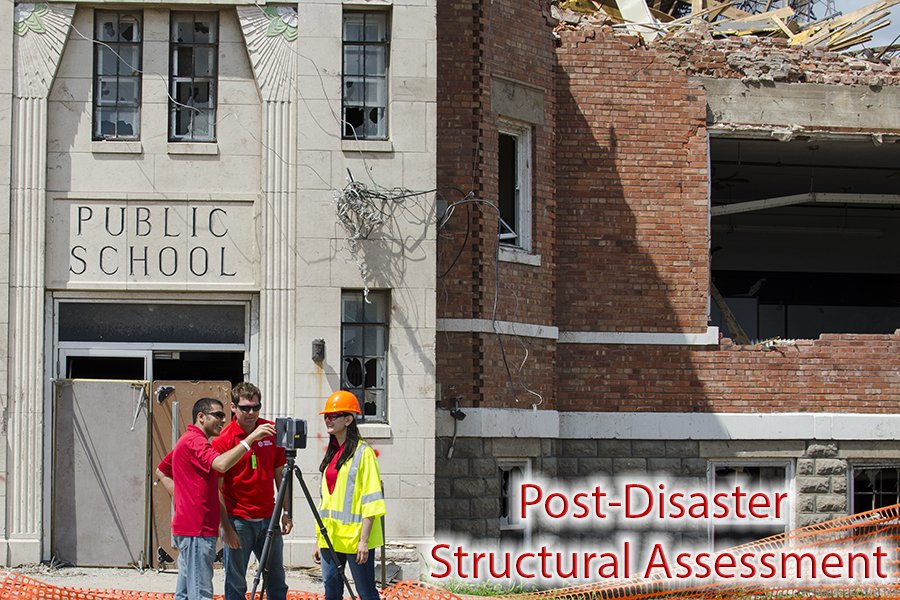
Point clouds collected from the December 2017 demolition at the Unversity of Nebraska-Lincoln City Campus. Two 13-story residence halls will be simultaneously imploded. Researchers from the Wood, Wittich, and Linzell research groups will be assessing the effect of various structural components, influence on adjacent buildings, and blast effects.
Cather Pound Set (lidar data set before extensive demolition) - Control various project states under "Scene" on the lefthand taskbar.
Additional pre and post-demolition unmanned aerial system generated models. Note these are textured meshes.
2017 Hurricane Harvey (Texas)
Site 1: Aransas County Airport, Rockport, Texas. Light gauge cold-formed steel hangers severely damaged following Hurricane Harvey. Lidar point clouds collected under funding provided by NSF GEER (trip 1 in September 2017).
Aransas County Airport, Rockport, Texas
Site 2: Cove Habor Marina and Dry Stack, Rockport, Texas. Light gauge cold-formed steel dry boat stacks severely damaged following Hurricane Harvey. Lidar and unmanned aerial system point clouds collected under funding provided by NSF GEER (trip 1 in September 2017) and NSF ENH (trip 2 in October 2017).
Cove Harbor Dry Stack, Rockport, Texas (trip 1)
Cove Harbor Dry Stack, Rockport, Texas (trip 2 - a more detailed dataset coming soon)
Cove Harbor Dy Stack, Rockport, Texas (UAS textured mesh)
El Centro, California - Imperial Cabinets Building
A two-story reinforced concrete building with unreinforced masonry (URM) units. Constructed in the 1920s and was red-tagged following the 2010 Sierra El Mayor (Baja California) Earthquake. Subjected to further forced vibration tests to understand the role of URM and its influence on dynamic properties. Experimental testing was led by SUNY Buffalo (Andreas Stavridis) and Tufts University (Babak Moaveni). Remotely collected lidar point clouds are available for review here:
El Centro (Pretest)
El Centro (Posttest) - forthcoming
2015 Gorkha (Nepal) Earthquake
Remote sensing data collected during detailed reconnaissance assessments following this earthquake. Data shown here is collected in collaboration with Oregon State University.
Datasets externally hosted: